
This project adopts an optical system based on the electro-optic acoustooptic effect as the initial design structure of the interferometric all-time star sensors. Its optical structure is shown in Figure 3-1, mainly consisting of a filter, polarizer, electro-optical frequency shifting device (bubble cell), imaging lens, and array detector.
Figure 3-1 Structural diagram of an all day star sensor based on electro-optical interference
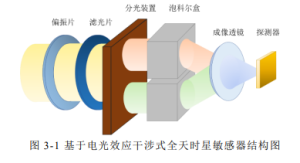
The light emitted by the star target and the sky background light enter the star sensor lens and are first filtered through a narrowband filter. A filter can filter out the background light in the sky, which helps to improve the signal-to-noise ratio of star observations throughout the day; Meanwhile, narrow band stellar light will have better temporal coherence, which can enhance the complex coherence of the light field and facilitate the generation of fringes.
After being filtered by a filter, the light passes through a polarizer to polarize the star target and the sky background light. On the one hand, the deviation of the target light of a star can satisfy the interference conditions of the same vibration direction for the stellar light; On the other hand, due to the elliptical polarization characteristics of background radiation, polarizers can eliminate some of the sky background radiation and improve the contrast of star targets.
After polarization treatment, the light is divided by the splitting device, and the two beams of light enter two bubble cole boxes respectively. Bubble cell is an electro-optic frequency shifter based on the electro-optic effect. The applied voltage can linearly change the refractive index of the crystal inside the Bubble cell, thereby changing the optical path length of light transmission inside the Bubble cell. One of the bubble cells is subjected to periodic modulation voltage, while the other bubble cell is not subjected to voltage. As a result, a periodically changing optical path difference is introduced between the two beams of light, resulting in a grayscale change over time on the detector
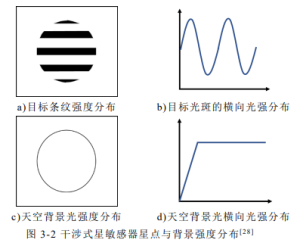
The distribution of striped patterns.
After the two beams of light converge again and are imaged through a focusing lens, the stellar starlight will form a small distribution of stripes that change with time on the detector plane (but due to the diffraction effect of diffraction limited systems, the main maximum stripe brightness may be obvious, while other levels of stripes may be suppressed, resulting in smaller light spots with temporal gray fluctuation characteristics on the detector plane instead of stripes). Due to the characteristic of a large angle diameter extended light source in the sky background, the spatial coherence of the background light is poor, resulting in an approximately uniform light intensity distribution on the detector plane. The distribution of star points and background intensity of the interferometric star sensor is shown in Figure 3-2.
Figure 3-2 Distribution of star points and background intensity in reciprocal star sensors
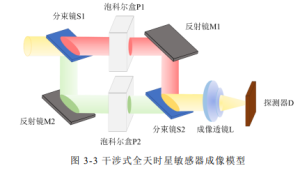
Analyze the imaging principle of interferometric all day star sensors from the perspective of mathematical models. The imaging model of the interferometric star sensor is shown in Figure 3-3. The beam splitter S1 divides the incident light into two parts, one of which passes through the unpowered bubble cell P1 and is reflected twice by the reflector M1 and beam splitter S2; The other part is reflected by the beam splitter S1 to the reflector M2, and after being reflected again, it passes through the periodic voltage applied to the bubble cole box P2. It shoots out from the beam splitter S2 and interferes with the reflected light of the beam splitter S2. It is imaged onto the detector D through the imaging lens L, and finally forms an interference pattern at the detector.
Figure 3-3 Imaging Model of Interferometric All Sky Star Sensor
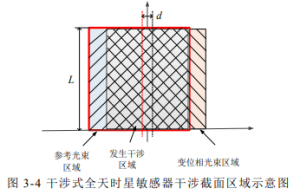
After passing through the beam splitter S2, two beams of light will generate relative translation of the beam coverage area. Shear interference occurs in the common area of the two beams of light, as shown in Figures 3-4.
Figure 3-4 Schematic diagram of the interference cross section area of the interference all day star sensor
The reason why interferometric star sensors have good ability to extract weak stellar signals is that in addition to fully utilizing the spatial coherence of stars as point light sources in the design of optical system principles, signal to noise ratio improvement techniques such as signal frequency domain conversion and filtering are also used in algorithm extraction.
Due to the uniform distribution of the sky background, it can be regarded as an extended light source with a large angle diameter, and has obvious DC component characteristics in the frequency domain. As a point target, stars have a smaller angular diameter, which corresponds to signals with higher frequencies in the frequency domain. By filtering low-frequency signals in the frequency domain, a preliminary improvement in the signal-to-noise ratio of star detection can be achieved.
The synchronous correlation detection algorithm is another important means for interferometric star sensors to improve the signal-to-noise ratio of star detection. Periodically modulate the star target signal to obtain the distribution of star information at different time periods, and demodulate it in the frequency domain through synchronous correlation detection algorithm for star map recovery. The demodulated signal is separated from the DC component corresponding to the sky background in the frequency domain. Through frequency filtering, the frequency of the target signal can be filtered out, and the star information can be restored, filtering out the sky background and ultimately generating a restored star image. The schematic diagram of the modulation principle of the interferometric star sensor on the signal is shown in Figure 3-5. Based on the restoration of star maps, star point extraction, star map recognition, and attitude calculation algorithms can be implemented.
Figure 3-5 Modulation of Signal Frequency by Interferometric Star Sensor
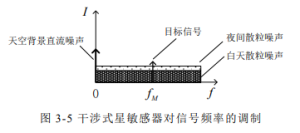
From this, it can be seen that interferometric star sensors can improve the detection signal-to-noise ratio in two aspects:
(1) The generation of interference fringes in stellar targets can exhibit different spatial frequency characteristics under a uniform sky background, which can be improved by frequency domain filtering to enhance the contrast of fringes and the detection ability of stellar targets.
(2) The introduction of synchronous correlation detection algorithm separates the periodically modulated star signal from the DC component of the sky background in the frequency domain, and the grayscale information of the star signal can be extracted through filtering. The spatial filtering technology based on stripe distribution and the synchronous correlation detection technology based on periodic grayscale information are the core means to improve the star point signal extraction ability of interferometric star sensors.
The optical path difference between the reference beam and the modulated beam is proportional to the applied voltage. When the applied voltage is a periodic sawtooth wave, a linear change in optical path difference can be achieved. After imaging on the image plane through a lens, the distribution of light intensity on the image plane is obtained by multiplying the complex amplitude of the light field by its conjugation using a mathematical relationship
Send us a message,we will answer your email shortly!